
Bowtie analysis is a risk visualisation method that places a hazard at the centre of a diagram and maps everything that could cause it on the left, and everything that could result from it on the right. Unlike a risk register, which lists risks and scores them, or a HAZOP, which identifies process deviations systematically, a bowtie makes the full risk picture visible in a single diagram: causes, controls and consequences together.
The result is a tool that works at two levels. For safety professionals, it structures the thinking around a specific hazard in a way that HAZOP tables and spreadsheets don't. For managers and auditors, it communicates complex risk relationships clearly and without technical jargon. Both groups can look at the same diagram and understand what could go wrong, what is stopping it, and what happens if the controls fail.
But a bowtie diagram is only as useful as the barriers it shows and barriers only work if they are maintained, tested and functioning. That is where action tracking comes in. The bowtie identifies what the barriers are; action tracking ensures they stay in place. Together, they form a complete approach to managing major hazard risk from identification through to close-out.
What a Bowtie diagram contains
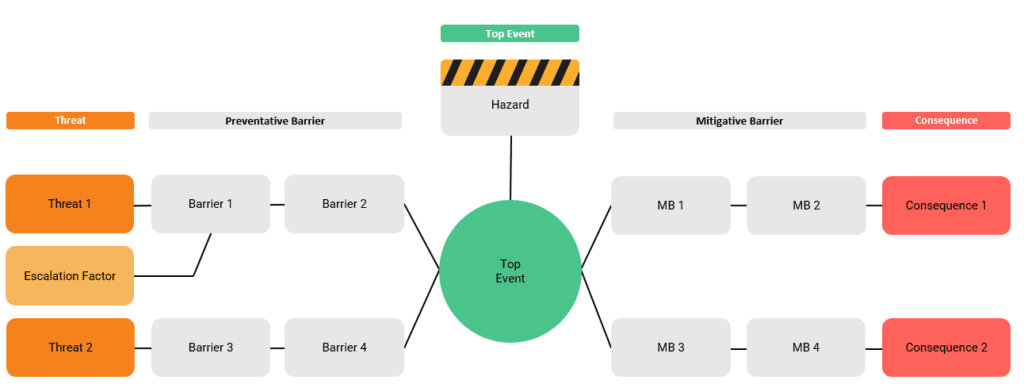
The diagram above shows the core elements of a bowtie. Each one has a specific role.
- Hazard: The central point of the bowtie diagram, representing a source of potential harm.
- Top Event: The critical event that occurs when control over the hazard is lost, leading to potential consequences.
- Threats: Factors or conditions that can cause the top event to occur. These are listed on the left side of the diagram.
- Consequences: Potential outcomes or impacts resulting from the top event. These are listed on the right side of the diagram.
- Preventive Controls: Measures implemented to prevent the threats from causing the top event. These controls are placed on lines connecting the threats to the top event.
- Mitigative Controls: Measures implemented to mitigate the consequences of the top event. These controls are placed on lines connecting the top event to the consequences. At this stage it is important to use a high-governance action tracker system to ensure that any mitigating actions are executed in a timely and effective manner.
- Escalation Factors: Conditions that can weaken or disable preventive and mitigative controls.
- Escalation Factor Controls: Measures to manage the escalation factors and maintain the effectiveness of the primary controls.
Bowtie vs HAZOP: how they fit together
HAZOP and bowtie analysis are complementary techniques, not alternatives. A HAZOP is a systematic, guide word-based study that identifies process deviations, their causes and their consequences. It produces a detailed record of every deviation considered, with recommended actions for each.
Bowtie takes selected hazards from the HAZOP output and visualises the full risk picture for each one. Where a HAZOP produces rows in a table, a bowtie produces a diagram that shows the whole story, including threats, barriers and consequences, in a format accessible to people who were not in the HAZOP room.
The typical workflow is HAZOP first, then bowtie for the major hazards. HAZOP actions feed directly into the barriers shown on the bowtie, and those barriers then drive the action tracking register. For a deeper look at how HAZOP compares to other study techniques, see our guide to HAZID vs HAZOP.
Bowtie vs Risk Register
A risk register lists risks, assigns likelihood and severity scores, and records controls. It is a useful management tool but it has a fundamental limitation: it tells you a risk exists and has a score, but it does not show you why, or what is actually stopping it from escalating.
A bowtie diagram addresses that gap. It shows the causal pathway from threat to top event to consequence, and it makes the barriers explicit and visible. You can see immediately if a barrier is absent, degraded or over-relied upon.
The limitation of a bowtie is that it is a static picture. It does not tell you whether the barriers it shows are actually functioning. A barrier that appears on a diagram but has not been inspected, tested or maintained is not a barrier; it is a false assurance. Closing that gap is the role of action tracking.
Where Action Tracking fits: the critical link
Every barrier on a bowtie diagram represents a commitment. That commitment has to be backed by actions: scheduled inspections, test records, corrective findings and close-out evidence. Without them, the bowtie is a document rather than a safety system.
The connection works like this. Each prevention and recovery barrier generates a set of recurring actions: inspect this valve quarterly, test this emergency stop monthly, review this procedure annually. Those actions need owners, due dates and a record of completion. When an inspection raises a finding, whether that is a valve not operating correctly or a procedure that is out of date, a corrective action is created and tracked through to resolution.
This is exactly what a structured action tracking system is designed to manage. It links the barrier to the action, the action to the owner, and the close-out to the audit trail. When an auditor asks whether a barrier on the bowtie is functioning, the answer is in the action register rather than in someone's memory.
For a full guide to how action tracking supports process safety across an organisation, see our guide to action tracking. For organisations using a permit to work system alongside bowtie analysis, the PTW system itself forms one of the key prevention barriers and the permit record provides part of the audit trail. See our permit to work system for more on how that works in practice.
Bowtie analysis in oil and gas and offshore
Bowtie analysis has deep roots in the oil and gas sector. Following the Piper Alpha disaster, the UK offshore industry developed a much more rigorous approach to major accident hazard management, and bowtie became one of the standard tools for demonstrating that major risks were identified, controlled and managed to ALARP.
Today, bowtie is used across the sector for hazards including loss of well control, loss of process containment, structural integrity failure, dropped objects and simultaneous operations. It is a recognised methodology under the Safety Case regime for offshore installations, and it is commonly used to support COMAH compliance onshore.
The oil and gas application is also where the link between bowtie and action tracking is most critical. The consequences of barrier failure in this environment are severe. Regulators expect not just that barriers are identified, but that there is documented evidence they are being maintained and tested. An action tracking system that links directly to the barriers on the bowtie provides exactly that evidence.
Benefits of Bowtie Analysis
Bowtie Analysis offers several advantages that make it a valuable tool for risk management:
- Visual Representation: The bowtie diagram provides a clear and concise visual representation of the risk pathways, making it easier to understand and communicate risks and controls.
- Holistic Approach: By combining elements of fault tree analysis and event tree analysis, Bowtie Analysis offers a comprehensive view of risk management, addressing both prevention and mitigation.
- Engagement and Collaboration: The methodology encourages collaboration among different stakeholders, fostering a shared understanding of risks and controls.
- Focus on Controls: Bowtie Analysis emphasises the identification and management of controls, helping organisations ensure that critical measures are in place and effective.
- Flexibility: The technique can be applied to various types of hazards and industries, making it a versatile tool for risk management.
Bowtie analysis limitations
Bowtie is a powerful tool but it has limits worth understanding before you rely on it.
It is a snapshot rather than a live system. A bowtie diagram reflects the understanding of risk at the time it was drawn. As processes change, new threats emerge or barriers are modified, the diagram needs to be updated and that update needs to be managed as a formal action.
It can oversimplify complex causal chains. A single threat node on a bowtie may represent a combination of conditions. Bowtie works best for well-understood, discrete hazards where the causal logic is clear. For novel or systemic risks, techniques like fault tree analysis may be more appropriate. Our guide to FMEA and hazard analysis covers some of the alternatives.
Barrier effectiveness is assumed rather than measured. The diagram shows that a barrier exists. It does not show whether it is working. This is the most important limitation and the one that action tracking directly addresses.
Bowtie Analysis Software
Dedicated bowtie software tools provide structured environments for building and managing bowtie diagrams. They offer features like barrier libraries, escalation factor mapping and version control that are difficult to replicate in PowerPoint or Visio.
However, bowtie software tools typically stop at the diagram. They record what the barriers are but they don't fully manage the actions needed to keep those barriers functioning. That requires a separate action tracking system integrated into your wider safety management process which provides the level of governance and auditability which are required by auditors and investigators.
The most effective approach combines a dedicated bowtie tool for diagram creation with a structured action tracking system for barrier maintenance. The Pisys Action Tracker is used by process safety teams for exactly this purpose — managing the recurring inspection, testing and corrective actions that sit behind each barrier on the diagram.
Getting started with Bowtie analysis
A bowtie study works best as a focused workshop. The right people to have in the room are the process owner, the HSE lead, a technical expert familiar with the hazard, and someone with operational experience of the controls.
Before the session, gather the HAZOP output for the hazard in question, any relevant incident or near-miss history, and the current control register or risk assessment. These give the starting point for identifying threats and barriers rather than starting from scratch.
Tackle one top event at a time. A single bowtie session typically produces one or two completed diagrams. Trying to cover too many hazards in one session reduces the quality of the analysis.
Once the diagram is complete, the immediate output is a list of barriers. Each barrier should be assigned to an owner and entered into the action tracking system with a schedule for inspection or review. That step, transferring the barrier list into tracked actions, is what turns the bowtie from a diagram into a functioning part of the safety management system. Our Action Tracker helps manage that process in practice.