SIMOPS and Permit to Work: Managing Simultaneous Operations Safely
Simultaneous Operations, commonly referred to as SIMOPS are a fact of life in complex work environments. Whether you’re coordinating construction and maintenance on an industrial site, managing multiple activities on an offshore platform, or running concurrent workstreams across a campus or facility, SIMOPS situations introduce additional layers of risk.
The term SIMOPS describes multiple activities taking place at the same time in locations where they might interact or interfere with each other. These interactions can create hazards that are not present when activities are planned independently. Effective control of simultaneous operations therefore requires clear visibility, careful planning, and systems that help teams manage risk in real time.
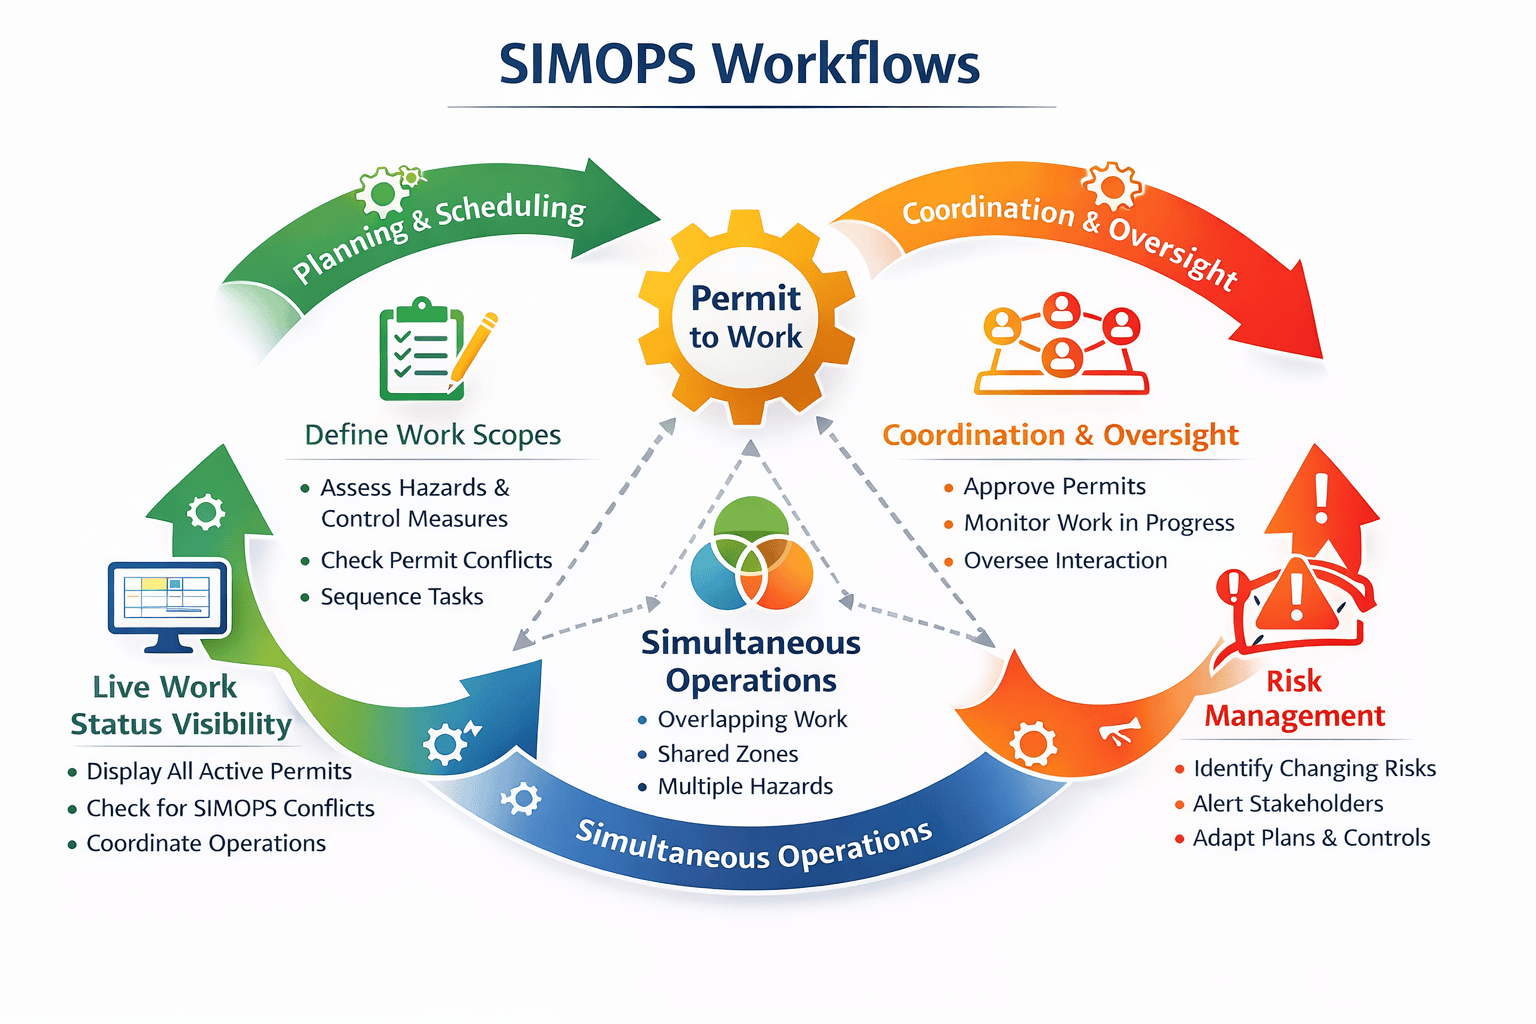
A Permit to Work (PTW) system, when implemented and used well is a process for issuing work authorisations AND a dynamic control mechanism that supports the safe coordination of SIMOPS.
Why Simultaneous Operations Introduce Risk
Simultaneous operations increase complexity because they blur the boundaries between work activities. Tasks that are safe in isolation may interact in unexpected ways when conducted at the same time.
For example, a crane lift in one area may create hazards for personnel performing electrical isolations in an adjacent zone. Or maintenance work on pressure systems may coincide with personnel movements in work access corridors, creating potential for dropped objects or collision risk.
In a SIMOPS context, hazards do not stand still. An activity that was safe when authorised may become unsafe when another operation begins or environmental conditions change. Without a system that allows teams to see all work that is active at any moment, SIMOPS can easily create blind spots in risk management.
Permit to Work as a Control Framework
A Permit to Work system provides a formal control framework for high-risk activities. It defines:
- What work is to be done
- Where and when it will happen
- What hazards are present
- What controls are required
- Who is authorised to do the work
When used in a SIMOPS environment, a PTW system becomes a central coordination tool.
Rather than focusing solely on individual tasks, a Permit To Work system helps teams understand the collective impact of multiple active operations.
Visibility of Active Work
One of the core challenges in SIMOPS is knowing what work is active right now.
A well-implemented PTW system provides live visibility of all active permits. Supervisors, safety teams and site controllers can see, at a glance, what operations are underway, where they are located and what risks they involve. This visibility is essential for identifying potential conflicts between activities before they escalate into hazardous situations.
For example, simultaneous hot work and material handling in the same vicinity might require additional controls such as exclusion zones, fire watches or sequencing of tasks.
In the absence of this visibility, teams may only find out about conflicting work when an incident occurs, by which point it is too late to manage the interaction safely.
Plot Plans and their role in SIMOPS Management
Traditional PTW systems use permit boards to display information on all permits in force. However, since the permit boards are often manually updated they can often be out of date. It is also often difficult for the information on the board to be visible to both those managing permits and performing tasks, particularly where SIMOPS could cause an issue.
Having a clear picture of all activities in a worksite helps everyone, as long as this information is presented in a way that is easy to interpret and which does not cause confusion. Layout diagrams (or 'Plot Plans') can be produced using existing CAD drawings and easily updated.
There are several factors which affect the complexity of SIMOP management in a permit to work system. Complex worksites with a large number of areas can make identifying SIMOPS more difficult, especially if it is difficult to visualise the areas (e.g. rooms in a large office building may all be of similar sizes and have no particular unique characteristics other than location).
Ideally, activities likely to be in close proximity should be automatically highlighted so that they can be easily identified. Multi-level sites can also introduce complexity however a capable PTW system should provide the facility to access multiple plot plans covering all levels easily, with automatic identification of activities which may affect jobs on other levels (for example hot work on a ceiling area may affect the level directly above).
Identifying Work Conflicts Early
One of the strongest benefits of integrating SIMOPS thinking into a PTW system is the ability to identify conflicts before work starts.
When a new permit is being raised, the system should allow the planner, reviewer or authoriser to see all other active and planned permits in the same area or with overlapping risk profiles. This enables conflict checks such as:
- Are two high-risk activities planned in the same zone at the same time?
- Does one activity introduce hazards that affect another?
- Are exclusion zones or isolation requirements overlapping?
These checks help ensure that work is planned in a way that avoids hazardous interaction, or that additional controls are put in place if overlap is unavoidable.
Sequencing and Coordination
Not all simultaneous operations are inherently risky. Some can be coordinated safely through careful sequencing and timing.
A PTW system should support planners to sequence activities intelligently. For example:
- Task A may need to be completed or suspended before Task B starts
- High-risk tasks may be scheduled at times of lower overall activity
- Certain controls may need to be established before others can proceed
This sequencing is far easier to manage when all work activities and their hazards are visible within the permit framework. Teams can plan around each other rather than in isolation.
Dynamic Risk Management
SIMOPS is rarely static. Work that starts safely can become unsafe as other operations begin, conditions change or unexpected events occur.
A robust PTW system supports dynamic risk management by allowing:
- Permits to be suspended, amended or closed in response to changing conditions
- Real-time updates when work scope changes
- Notifications to stakeholders when new conflicts arise
This flexibility is critical in environments where conditions can change rapidly, such as offshore platforms, construction sites or busy industrial facilities.
By managing risk dynamically, teams avoid the false assurance that comes with static paperwork and instead maintain a real-time picture of operational risk.
Clear Roles and Communication
SIMOPS control is a team sport. It requires everyone involved to understand their roles, responsibilities and the interactions between activities.
A PTW system provides a structured communication framework. It ensures that:
- Work scopes and controls are clearly documented
- Approvers are aware of related activities
- Field teams understand when and why work may need to change
Supervisors can coordinate handovers and transitions
This clarity reduces ambiguity and helps ensure that SIMOPS planning and execution are carried out with shared understanding.
Supporting Incident Prevention and Response
Near misses and minor incidents in SIMOPS environments often provide early signals of deeper coordination issues. When a PTW system captures these events and links them to active work scopes, it helps organisations spot patterns in how simultaneous operations interact.
This information can inform adjustments to planning, control measures, training and supervision, reducing the likelihood of more significant incidents.
If an incident does occur, the PTW records provide a clear picture of what work was active, what controls were in place, and how activities interacted. This supports more effective investigation and learning.
Practical Implementation Tips
To make PTW effective for SIMOPS control, organisations should consider:
- Configuring the system so that all active and planned permits are visible in a shared dashboard
- Ensuring that reviewers and authorisers can see other related work when assessing a new permit
- Defining spatial relationships (zones or areas) so that work in proximity can be checked for conflicts
- Building sequencing and dependency logic into workflows
- Allowing permits to be updated easily as conditions change
- Supporting communication and handover between shifts and teams
These capabilities ensure the PTW system becomes an operational tool for coordination, not just a compliance form.
Summary
Simultaneous operations introduce risk because they change the context in which work is done. Tasks that are safe in isolation can interact in ways that increase exposure or weaken controls.
A Permit to Work system, when properly implemented, provides the visibility, structure and flexibility needed to manage SIMOPS effectively. It helps organisations understand what work is active, identify conflicts early, coordinate activities and respond to changing conditions.
Rather than seeing PTW as an admin overhead, organisations that integrate SIMOPS thinking into their PTW processes gain a practical tool for safer, more confident operations in complex environments.
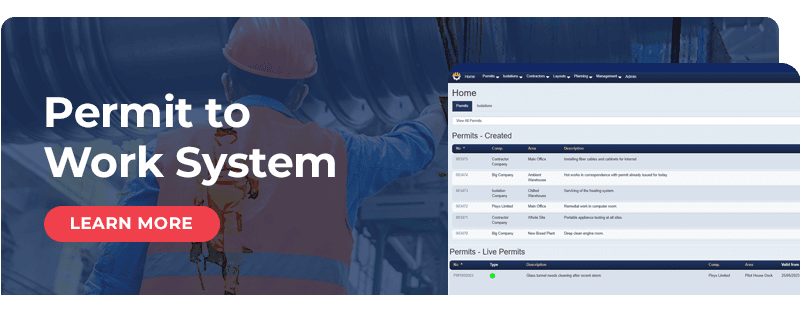
The Pisys Electronic Permit to Work system includes a live permit board and plot plan visualisation, giving supervisors and safety teams a complete picture of all simultaneous operations at any given moment.