Governance is only as strong as the information that supports it. Senior leaders and safety managers can put the right structures in place, appoint the right people, and run the right processes, but without reliable visibility into what is actually happening on the ground, decision-making becomes reactive and accountability becomes difficult to demonstrate.
Action tracking is one of the most practical tools available for closing this gap (Read this article for an introduction) . When it is embedded consistently across an organisation, it does something that individual reports and email updates cannot: it generates a continuous, structured picture of how risk and improvement activities are being managed, from the most recent HAZOP recommendation to the oldest outstanding audit finding.
What Governance Actually Requires
In the context of process safety and HSE management, governance means being able to demonstrate that risks are being identified, that actions are being taken to address them, and that those actions are being verified as effective. It means having clear ownership, defined timescales, and an audit trail that holds up to scrutiny, whether that scrutiny comes from an internal review, a regulator, or following an incident.
The challenge most organisations face is that this information exists, but it is scattered. Actions sit in meeting minutes, inspection reports, HAZOP worksheets, and individual inboxes. No single person has a complete picture, and assembling one requires significant manual effort. By the time a consolidated view is ready, it is already out of date.
A structured action tracking system changes this by creating a single, authoritative source of record. Every action, regardless of where it originated, is captured, assigned, and tracked in one place. The result is that governance becomes something you can demonstrate in real time and not have to 'reconstruct after the fact'.
The Role of Dashboards
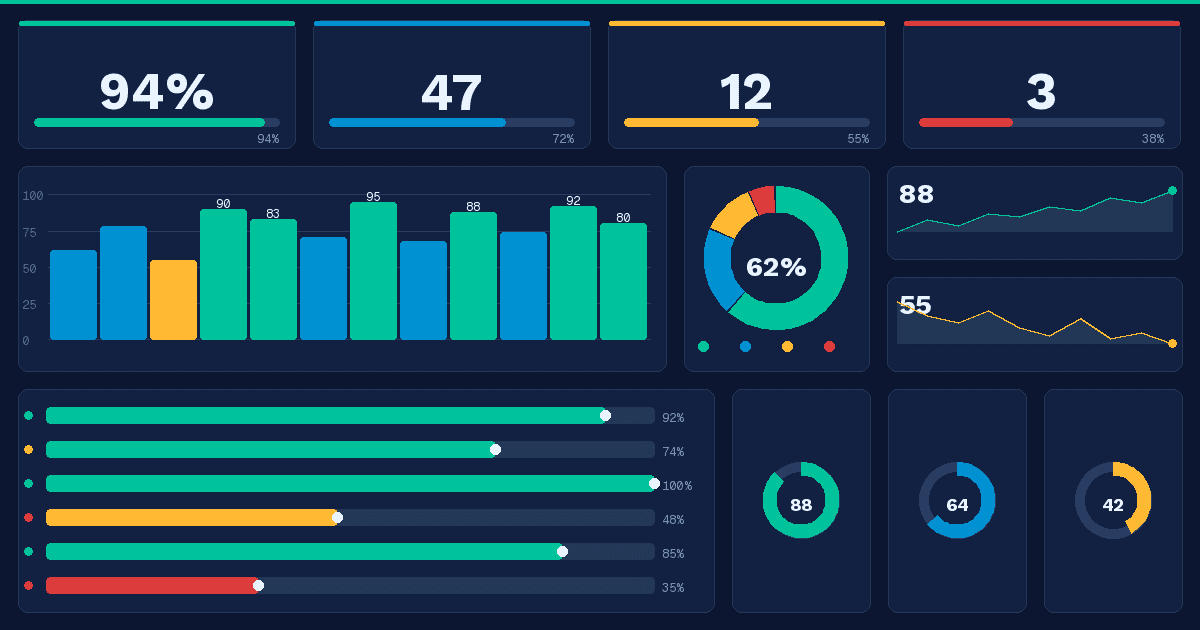
Dashboards are how governance becomes practical for leaders who cannot be close to the operational detail of every workstream. A well-designed action tracking dashboard translates the state of the action management system into meaningful management information.
This might include the number of overdue actions by department or site, the proportion of high-risk actions that have been closed within their target timescale, trends in action completion rates over time, or a breakdown of actions by origin such as HAZOP, audit, incident investigation, or management of change. Each of these views tells a different part of the story, and together they allow a senior manager or safety committee to understand where performance is strong, where it is deteriorating, and where intervention is needed.
The value of dashboards is not just in what they show, but in what they make unnecessary. When good data is surfaced clearly, leaders do not need to chase updates from multiple teams or wade through detailed reports before every governance meeting. The dashboard provides the context. The meeting can focus on decisions.
Connecting to Power BI, APIs, and Wider Business Intelligence
The built-in dashboards within an action tracking system give a focused view of action performance, but many organisations want to go further by incorporating that data into their wider reporting environment. This is where APIs and business intelligence tools such as Power BI become particularly valuable.
A well-designed action tracking system will expose its data through an API, allowing other systems to query action status, completion rates, overdue items, and categorisation data in real time. This means that action tracking information can be pulled directly into Power BI reports or dashboards alongside data from other operational, safety, or business systems, without anyone needing to export spreadsheets, copy figures manually, or maintain separate summary documents.
The practical benefit is significant. A Power BI dashboard built on live API data can show, in a single view, how process safety action completion rates are trending alongside operational performance metrics, maintenance backlog figures, or incident frequency rates. Patterns that would be invisible in siloed reporting become apparent when the data is brought together. A site that is falling behind on high-risk HAZOP actions while also seeing a rise in process deviations is giving an early signal that warrants attention, and that signal only becomes visible when the data sources are connected.
APIs also support integration with other enterprise systems. Organisations that use ERP platforms, maintenance management systems, or permit to work software can link action tracking data into broader workflows, ensuring that actions requiring maintenance work orders or engineering sign-off are connected to the systems where that work is actually managed and recorded.
For organisations with multiple sites or business units, this kind of integration allows performance to be compared and aggregated at a corporate level in a consistent and automated way. Senior leaders and process safety functions can access a real-time picture of action management performance across the whole organisation without relying on each site to produce its own reports to its own format and schedule.
Process Safety Performance Visibility
Process safety performance is notoriously difficult to measure in real time. By the time a major incident occurs, the conditions that made it possible have often been present for some time: eroded barriers, incomplete actions, deferred maintenance, accumulated deviations from safe operating limits. The challenge is identifying those conditions before they combine into something serious.
Action tracking contributes directly to this kind of leading indicator visibility. The status of process safety actions, particularly those arising from HAZOPs, LOPAs, safety critical equipment reviews, and management of change processes, reflects the health of the barriers that stand between normal operations and major accident hazards. An organisation carrying a large number of overdue high-risk process safety actions is carrying risk that may not be visible in its lagging indicators.
Making these actions visible requires categorising them in a way that reflects their safety significance, tracking whether verification has been completed alongside closure, and monitoring trends over time rather than treating each review cycle in isolation. When this is done well, process safety performance becomes something that can be actively managed.
This is particularly important in complex or multi-site organisations where process safety responsibilities are distributed across engineering, operations, maintenance, and management. No individual has visibility across all of these functions. Action tracking with appropriate dashboards and reporting provides the shared view that makes coordinated process safety management possible.
Accountability Without Micromanagement
One of the tensions in governance is the relationship between oversight and operational autonomy. Leaders need confidence that actions are being progressed, but constantly chasing updates undermines the ownership that makes action management effective in the first place.
Well-designed action tracking resolves this by making accountability structural rather than personal. When actions are clearly assigned, deadlines are visible to everyone, and when completion rates are reported at a team or department level, the system itself creates the conditions for accountability. Individuals know their actions are visible. Managers can see at a glance whether their teams are on track. Escalation happens through process as opposed to repeated requests for updates.
This also means that when actions are delayed, the reasons become easier to understand and address. A team that is consistently behind on process safety actions may be under-resourced, dealing with competing priorities, or may be encountering technical obstacles that need resolving at a higher level. The dashboard reveals the pattern and the governance process can then respond to it.
From Data to Continuous Improvement
Over time, the data generated by consistent action tracking becomes an asset in its own right. Organisations can identify which types of studies or activities generate the most follow-up work, which control measures are repeatedly found to be inadequate, and where the same issues are recurring across different sites or time periods. This is the kind of insight that moves process safety management from reactive to genuinely preventive.
It also supports more honest conversations at board and leadership level about the resources and attention that process safety requires. When performance data is visible and credible, it is harder to defer or deprioritise. When it is fragmented or unreliable, it is easier to assume things are under control.
Governance, dashboards, and process safety performance visibility are not separate capabilities. They are three expressions of the same underlying need: to know what is happening, to be able to demonstrate that risks are being managed, and to act on that knowledge before problems become incidents.
Action tracking, connected to the right reporting tools and integrated into the wider business intelligence environment, is what makes all three possible in practice.
The Pisys Action Tracker provides real-time dashboards and performance reporting across all action sources, giving leadership teams the visibility they need to monitor progress, identify trends and demonstrate governance with confidence.