Published: 20 February 2026
Updated: 12 July 2026
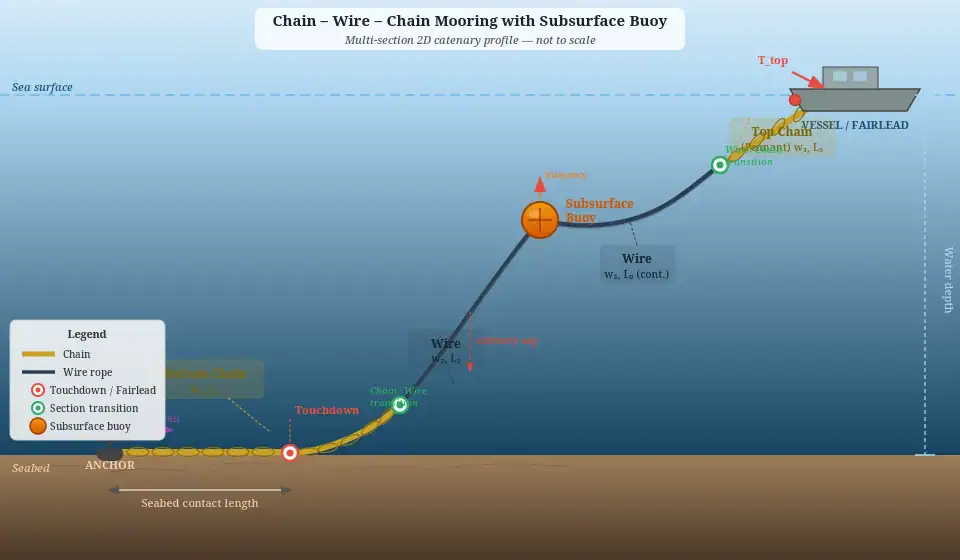
Multi-section lines are the norm offshore: chain–wire–chain, chain–synthetic–chain, wire with clump weights, pennants, and all the practical “bits” that make a real mooring line behave differently from a single uniform cable. If you treat that as one averaged line, you’ll often get the right shape but the wrong loads, or the right loads in the wrong place.
This post explains how to model chain-wire combinations properly in a 2D catenary context, what inputs matter, what outputs to sanity-check, and the common traps that cause "looks right, but isn’t". It's part of a series on Catenary Calculation and Management - learn more about the basic principles
Why chain–wire behaves differently from a single line
A classic uniform catenary assumes constant submerged weight per unit length along the whole line. Chain-wire systems break that assumption:
Submerged weight changes by section
Chain is typically much heavier per metre than wire rope; synthetic is often much lighter.
Touchdown and seabed contact becomes section-dependent
Heavier chain is more likely to lie on the seabed, shifting touchdown location and seabed contact length.
Tension distribution changes
The steep upper portion can sit mostly in wire, while the seabed portion is mostly chain. That changes end tensions and can change what your connectors/terminals see.
The practical consequence: end tensions, horizontal restoring force, and seabed contact length can shift materially just by changing section lengths, even at the same total payout.
The minimum you need to define each section
For a 2D catenary-style model, a good management workflow will let you define each section with:
1. Length (as-installed / paid out)
2. Submerged weight per unit length (in water, not in air)
3. Axial stiffness (optional, model-dependent)
Some 2D tools use pure geometric catenary; others incorporate stretch. If stretch is included, stiffness becomes important, especially for wire and synthetic. We will talk later about why quasi-static 2D catenary calculation is not always enough
4. Diameter / drag (usually omitted in simple 2D static)
Drag matters more in current/dynamic models, but some workflows still record diameter for traceability.
For chain–wire–chain, that becomes:
Bottom chain: (L_1), (w_1)
Mid wire: (L_2), (w_2)
Top chain / pennant: (L_3), (w_3)
A Practical modelling workflow
1) Start with geometry and boundary conditions
You need:
- Water depth and fairlead elevation
- Horizontal offset (fairlead to anchor, or end-to-end)
- Seabed profile assumptions (flat vs slope)
- Seabed interaction model (touchdown allowed? friction coefficient?)
Even before you get into line sections, these choices shape where the line wants to lie.
Tip: If you’re doing clearance or seabed interaction, don’t neglect friction. Friction is often the difference between "line slides and shortens the suspended span" vs "line sticks and increases top tension".
2) Build the line from the seabed up
For moorings, define sections in the physical order they appear:
1. Bottom chain near anchor (often intended to lie on seabed)
2. Wire mid-section (typically the long suspended portion)
3. Top chain / pennant to fairlead (sometimes added for handling, wear, or connector geometry)
This matters because which section is near touchdown influences:
- How much line ends up on the seabed
- How quickly tension rises with offset
- How the suspended shape transitions from "Lazy" to "Tight"
3) Solve for the "unknown" you actually care about
Most offshore problems fall into one of these categories:
- Given payout → compute shape + tensions
You specify total deployed length and want profile, touchdown, and end loads. - Given target tension → compute required payout/offset
Common in operations: "keep fairlead tension below X". - Given clearance requirement → compute allowable offsets
"Maintain Z metres clearance above pipeline"
A good system should let you hold the right variable constant and solve the rest, manual iteration can easily be avoided .
4) Run an envelope, not a single case
For chain–wire combinations, small changes in offset/payout can produce section “phase changes”, such as:
- The wire section becoming fully suspended vs partially seabed-influenced
- Touchdown shifting from chain into wire (usually a red flag)
- The top chain lifting off sooner than expected
So run an envelope:
- 3–5 payouts (e.g., nominal ± a few percent)
- 3–5 offsets (expected operational range)
- With/without friction (if uncertain)
- Flat vs worst-case slope (if seabed not perfectly known)
What outputs to check
Touchdown location and seabed contact length
For a typical chain–wire–chain mooring:
- Touchdown should usually occur in the bottom chain, not in wire.
- Seabed contact length often increases with payout and decreases with offset.
If your model shows wire lying on seabed for a configuration where you expect bottom chain to be there, double-check:
- Section ordering
- Section weights (submerged)
- Total payout vs geometry
- Friction assumption
End tensions and horizontal component
Two numbers offshore teams care about:
- Top (fairlead) tension
- Horizontal restoring force (or horizontal tension component)
For multi-section lines, the top tension can jump when:
- Seabed contact reduces (more line is suspended)
- Friction prevents sliding (more load carried to the top)
- The heavy section begins to lift
Which section is where along the profile
A strong management system should make it obvious (visually and in tables):
- Which section occupies each part of the catenary curve
- The arc-length positions of section transitions
- The tensions at those transitions (if reported)
If you can’t see section transitions clearly, it’s easy to miss a bad configuration.
When quasi-static 2D catenary isn't enough
A 2D static catenary gives you the equilibrium shape and mean tensions, it tells you where the line sits and what it carries under a steady applied offset. That's useful, but it's not the whole picture for most offshore mooring problems.
Wave-frequency vessel motions impose oscillating fairlead displacements that a static model can't capture, and the resulting dynamic tension amplification can be significant, particularly in taut or semi-taut configurations where the line has little geometric compliance left to absorb motion.
Synthetic rope sections compound this: their non-linear load-extension behaviour and relatively low damping mean snap loads can develop under conditions where a static model would predict a perfectly reasonable tension. Low-frequency drift loading driven by second-order wave forces and wind gusts tends to be better captured by quasi-static methods, but even there, the assumption that the line responds instantaneously to offset changes breaks down when inertia and drag in the line itself are significant.
As a practical rule of thumb: if your line is predominantly chain in a catenary configuration with substantial seabed contact, quasi-static 2D is often defensible for preliminary design and operational planning. If you have long synthetic sections, a taut or semi-taut geometry, or you're working on a fatigue or extreme event analysis, you need a time-domain or frequency-domain dynamic model and your 2D catenary results should be treated as inputs and sense-checks to that model, not the final answer.
Common mistakes when modelling chain–wire combinations
Mistake 1: Using wet weight inconsistently
People mix:
- Air weight,
- Submerged weight in seawater,
- Effective weight with buoyancy already baked in.
Pick one standard (usually submerged weight per metre in seawater) and stick to it.
Mistake 2: Averaging properties across the full line
An "average weight per metre" can give a plausible profile but will misplace:
- Touchdown,
- Seabed contact length,
- Tension distribution.
You’ll especially see errors when bottom chain is intended to act as a seabed catenary “buffer”.
Mistake 3: Forgetting connectors/pennants are sections too
Short pieces (pennants, bridles) can change:
- Fairlead angle,
- Vertical load component,
- Clearance near the vessel.
If it’s there physically, it deserves to be in the model (even if simplified).
Mistake 4: Wrong section order
This is more common than you’d think, especially when copying a template.
Always sanity-check: anchor → bottom chain → wire → top chain → fairlead
Mistake 5: Ignoring friction for seabed cases
No-friction models often predict more sliding and lower top tensions than you’ll see in reality.
If you don’t know friction, bracket it: low/medium/high.
Quick “sanity-check” heuristics
Use these as fast checks before you trust any numbers:
- If you increase payout at constant offset, top tension should generally decrease (more slack), and seabed contact should increase.
- If you increase offset at constant payout, top tension should generally increase, and seabed contact should decrease.
- Heavy bottom chain should usually mean touchdown sits in chain, not wire.
- If a small geometry change causes a huge tension jump, look for a lift-off transition (seabed contact disappearing) or a friction/stick-slip effect.
What a good catenary management system should support for multi-section lines
When you’re evaluating tooling or internal workflows, look for:
- Section-by-section property management (length, submerged weight, stiffness)
- Clear visual differentiation of sections on plots
- Reportable section transition points along the arc length
- Batch case management (offset/payout envelopes)
- Consistent units and validation checks
- Explicit seabed + friction modelling with assumptions captured in outputs
- Exportable tables/plots suitable for method statements and reviews
WinCAT supports all of this out of the box
WinCAT catenary analysis software is built for exactly these workflows — section-by-section line modelling, seabed interaction with friction, batch case management and exportable plots and tables for method statements and reviews. If you are working with chain-wire combinations and need a fast, reliable and repeatable approach, WinCAT catenary analysis software is a good option.